
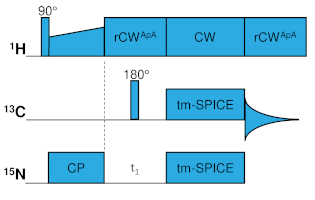
tm-SPICE NCA and NCO experiments
 |
You can download Bruker pulse program using the right-click here. |
Expand for experimental protocol
Experimental protocol
- Calibrate RF amplitudes for all channels using nutation experiment. We need a relation between RF power entered in the spectrometer software (Watts or dB) and the actual nutation frequency (kHz) of such pulse. Note that there is a systematic error due to large RF inhomogeneity - the actual RF amplitude in the coil center is about 10% larger.
- Optimize H-N transfer using 15N CP MAS experiment. We use ramp-CP with the linear ramp from 70% up to 100% of the RF amplitude applied on the 1H channel. Contact time of 1 ms is sufficient. This transfer is quite robust towards RF inhomogeneities at moderate MAS frequencies and does not lead to large losses in terms of sample volume pre-selection.
- Switch to NCA/NCO experiment. Set proper values for offsets to be on resonance with the required nuclei (15N amides about 120 ppm, 13C carbonyls about 170 ppm, 13C alphas about 55 ppm). On Bruker spectrometers, we use the possibility to set the offset during a pulse sequence with the
fqcommand. - Select proper RF shapes for tm-SPICE elements. Adjust their duration and RF amplitudes according to the actual MAS frequency used for the measurement. Our tm-SPICE shapes were calculated assuming duration of a fixed number of rotor periods \(N_R\) and a nominal maximal RF amplitude \(\nu_1^{NOM}\). Table below explains how to calculate the duration \(t\) and the required RF amplitude \(\nu_1\) for tm-SPICE shapes generated for 16.5 kHz MAS frequency. Before converting the RF amplitude to Watt/dB, lower it by 10% to compensate the calibration error explained in step 1.
| Nominal | Actual | |
|---|---|---|
| MAS frequency | \(\nu_R^{NOM}\) = 16.5 kHz | \(\nu_R\) = 18 kHz |
| Number of rotor periods | \(N_R\) =60 | \(N_R\) = 60 |
| Duration | \(t = N_R / \nu_R^{NOM}\) = 3636.36 μs | \(t = N_R / \nu_R\) = 3333.33 μs |
| RF amplitude | \(\nu_1^{NOM}\) = 35 kHz | \(\nu_1 = \nu_1^{NOM} \times \nu_R / \nu_R^{NOM}\) |
You should get nice signals. Sometimes, it is beneficial to optimize RF amplitudes of tm-SPICE pulses within \(\pm\)1 dB range.
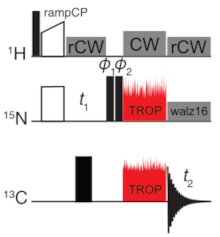
Sensitivity-enhanced TROP 2D NCA and NCO experiments
 |
You can download Bruker pulse program using the right-click here. |
Expand for experimental protocol
Experimental protocol
| Nominal | Actual | |
|---|---|---|
| MAS frequency | \(\nu_R^{NOM}\) = 20 kHz | \(\nu_R\) = 18 kHz |
| Number of rotor periods | \(N_R\) =70 | \(N_R\) = 70 |
| Duration | \(t = N_R / \nu_R^{NOM}\) = 3500 μs | \(t = N_R / \nu_R\) = 3888.89 μs |
| RF amplitude | \(\nu_1^{NOM}\) = 40 kHz | \(\nu_1 = \nu_1^{NOM} \times \nu_R / \nu_R^{NOM}\) = 36 kHz |
You should get nice signals. Sometimes, it is beneficial to optimize RF amplitudes of tm-SPICE pulses within \(\pm\)1 dB range.
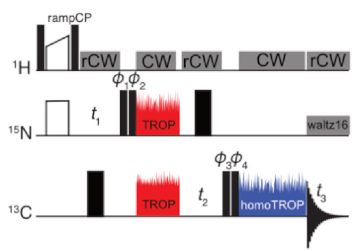
Sensitivity-enhanced 3D hNCACO and hNCOCA experiments with homonuclear TROP
 |
You can download Bruker pulse program using the right-click for the 3D se-hNCACO, and for the 3D se-hNCOCA. |
Expand for experimental protocol
Experimental protocol
| homoTROP | Nominal | Actual |
|---|---|---|
| MAS frequency | \(\nu_R^{NOM}\) = 20 kHz | \(\nu_R\) = 18 kHz |
| Number of rotor periods | \(N_R\) = 36 | \(N_R\) = 36 |
| Duration | \(t = N_R / \nu_R^{NOM}\) = 1800 μs | \(t = N_R / \nu_R\) = 2000 μs |
| RF amplitude | \(\nu_1^{NOM}\) = 40 kHz | \(\nu_1 = \nu_1^{NOM} \times \nu_R / \nu_R^{NOM}\) = 36 kHz |
WARNING: homonuclear TROP shapes are specific to magnetic field strength. Make sure you are using the right shape.
You should get nice signals. On some spectrometers we found it is necessary to optimize RF amplitudes of TROP pulses within a broader range below the expected values (down to about 70% of the calculated value). Investigation of this phenomenon is underway.
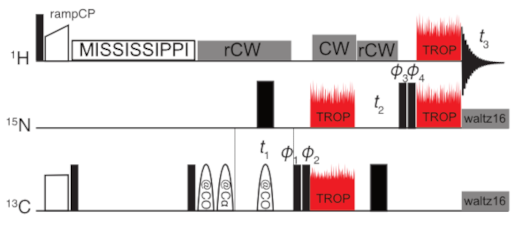
Sensitivity-enhanced TROP 3D hCANH and hCONH experiments
 |
You can download Bruker pulse program using the right-click for the 3D se-hCANH, and for the 3D se-hCONH. |
Expand for experimental protocol
Experimental protocol
| Nominal | Actual | |
|---|---|---|
| MAS frequency | \(\nu_R^{NOM}\) = 55 kHz | \(\nu_R\) = 58 kHz |
| Number of rotor periods | \(N_R\) = 200 | \(N_R\) = 200 |
| Duration | \(t = N_R / \nu_R^{NOM}\) = 3636.36 μs | \(t = N_R / \nu_R\) = 3448.28 μs |
| RF amplitude | \(\nu_1^{NOM}\) = 80 kHz | \(\nu_1 = \nu_1^{NOM} \times \nu_R / \nu_R^{NOM}\) = 84.4 kHz |
You should get nice signals. On some spectrometers we found it is necessary to optimize RF amplitudes of TROP pulses within a broader range below the expected values (down to about 70% of the calculated value). Investigation of this phenomenon is underway.
Sensitivity-enhanced 3D hCA(CO)NH and hCO(CA)NH experiments with homonuclear TROP
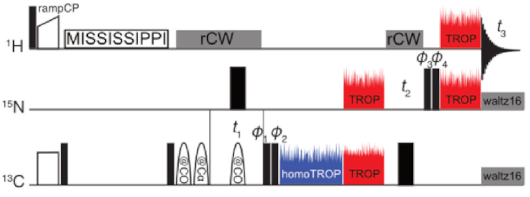 |
You can download Bruker pulse program using the right-click for the 3D se-hCA(co)NH, and for the 3D se-hCO(ca)NH. |
Expand for experimental protocol
Experimental protocol
| homoTROP | Nominal | Actual |
|---|---|---|
| MAS frequency | \(\nu_R^{NOM}\) = 55 kHz | \(\nu_R\) = 58 kHz |
| Number of rotor periods | \(N_R\) = 99 | \(N_R\) = 99 |
| Duration | \(t = N_R / \nu_R^{NOM}\) = 1800 μs | \(t = N_R / \nu_R\) = 1706.90 μs |
| RF amplitude | \(\nu_1^{NOM}\) = 75 kHz | \(\nu_1 = \nu_1^{NOM} \times \nu_R / \nu_R^{NOM}\) = 79.1 kHz |
WARNING: homonuclear TROP shapes are specific to magnetic field strength. Make sure you are using the right shape.
You should get nice signals. On some spectrometers we found it is necessary to optimize RF amplitudes of TROP pulses within a broader range below the expected values (down to about 70% of the calculated value). Investigation of this phenomenon is underway.
© 2021 optimal-nmr.net